With my friend Julian we thought it may be possible to identify a person entering into a building from the way it opens the building's door, analyzing the angular values over time.
It's because of the differences between human beings (physical and psychological) that anyone of us interact with our surroundings in a very unique way. The key thing here is to be able to recognize patterns for each individual, and then use them as identification method.
Input
The first step is to collect some samples, so we can have a nice test set to develop/train the recognition system.
To feed the system, we wanted to sample the angular position of a door at a fixed rate for a fixed amount of time. This sample will then be used as the 'fingerprint' of the person to be identified.
The experiment is going to take place with a garage door, where only a reduced amount of people has access.
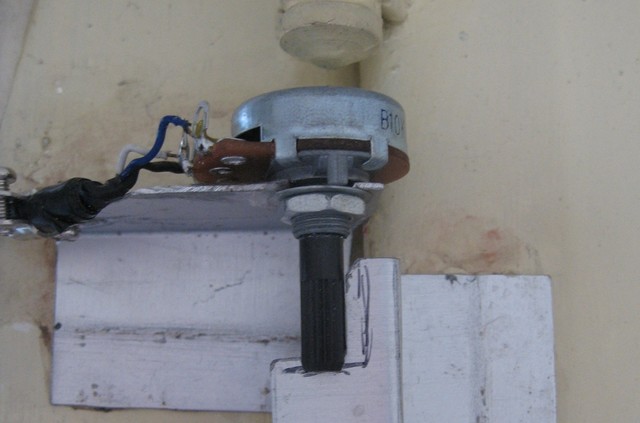
For the sensor we use a potentiometer with its body fixed to the wall, and the moving shaft attached to the door.
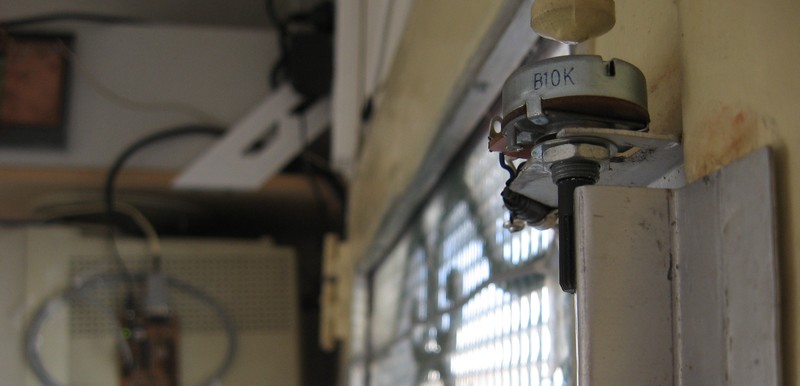
The potentiometer should be aligned with the door axis, allowing the moving shaft to follow the angular movements of the door.
Nice, we're all set. Now whenever someone opens the door, the potentiometer will track the movement all the time.
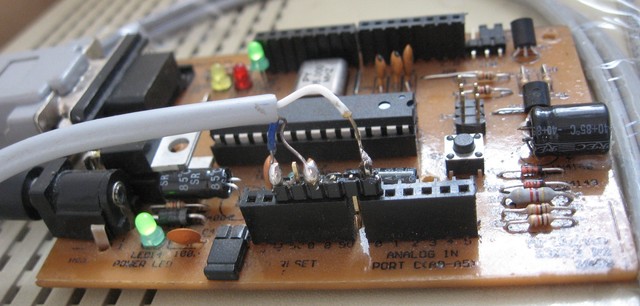
To process the signal we use an Arduino, and because we are students with no money it's my self made Severino version.
The signals of the potentiometer are directly connected to the Arduino, where it's digitalized/cuantified and then sent to a PC where it's going to be stored in a database for future processing.
We defined our data sample as the serie of measurements while the door is open. When the door is closed we don't care.
As the Arduino is very scarse on memory we have can't store the whole data sample on it, and then send it to the PC. We have to send every measurement away to keep the memory footprint low, and assemple the data sample on the PC which has more resources. The arduino runs a sketch wich performs the following:
- It calibrates the value of the door closed
- Detects when the door starts to open
- When its opened
- Measure the potentiometer signal
- Send this signal to the computer immediately (there is no enough memory on the arduino to store large samples)
- Wait a fixed amount of time before the next reading
- When the door closes send a special character to signalize the pc that the sampling finished (and it can be saved on the DB)
The code of the sketch looks like this:
1 2 3 4 5 6 7 8 9 10 11 12 13 14 15 16 17 18 19 20 21 22 23 24 25 26 27 28 29 30 31 32 33 34 35 36 37 38 39 40 41 42 43 44 45 46 47 48 49 50 51 52 53 54 55 56 57 58 59 60 61 62 63 64 65 66 67 68 | /*
Neuror - Door Interface Sketch
*/
/// Parametros de funcionamiento ///
#define Tolerancia 7
#define PinAnalogico 0
#define PinLedIndicador 13
#define TiempoEntreMuestras 20 // Valor en ms. + lo q toma enviar
// los 2/3/4/5 bytes por serial.
int i = 0;
int valorAD;
int valorMinimo = 1023; // Para forzar una recalibracion
void setup() {
Serial.begin(9600);
pinMode(PinLedIndicador, OUTPUT);
// Serial.println("READY!");
// Mostar q ya empieza el programa
digitalWrite(PinLedIndicador, HIGH);
delay(1000);
digitalWrite(PinLedIndicador, LOW);
/// RUTINA RECALIBRACION ///
valorAD = analogRead(PinAnalogico);
if ((valorAD-valorMinimo) <= -(Tolerancia/2)) {
// Hay q recalibrar el minimo. Si el minimo esta demasiado cerca
// del limite superior del CAD no hay q establecerlo tan cerca.
if ((1023-valorAD) > Tolerancia) {
valorMinimo = valorAD;
}
else {
valorMinimo =1023 - Tolerancia -1;
}
// Prendemos el led para mostar q se recalibro (sucking copypaste)
digitalWrite(PinLedIndicador, HIGH);
delay(500);
digitalWrite(PinLedIndicador, LOW);
delay(500);
digitalWrite(PinLedIndicador, HIGH);
delay(500);
digitalWrite(PinLedIndicador, LOW);
}
/// RUTINA RECALIBRACION ///
}
void loop() {
valorAD = analogRead(PinAnalogico);
if ((valorAD-valorMinimo) >= Tolerancia) {
digitalWrite(PinLedIndicador, LOW);
while((valorAD-valorMinimo) >= Tolerancia){
Serial.print(valorAD);
Serial.println();
delay(TiempoEntreMuestras);
valorAD = analogRead(PinAnalogico);
}
Serial.print("x"); // Esto indica el fin del sample
Serial.println(); // Esto indica el fin de la transmision
digitalWrite(PinLedIndicador, HIGH);
}
delay(10); // Evita falsos samples cuando la puerta 'rebota'
}
|
To recieve the data we reconditioned some old hardware, and we plug the Arduino Severino to the serial port (I like old fashion). If you're interested you can read about how to invert your monitor coils.
The data is now received on the PC through the serial port. To keep it simple we run a SQLite database and a python script which constantly waiting for data. The script recieves all the measurements in secuence, and when the newline caracter arrives it will recognice it as the end of the sample and store it in the database.
So a little more of detail:
- Connect to the database and get a cursor
- Open the serial port
- Go in a loop where:
- It receives each reading until a
newlinecharacter signalizes the end of the sampling - Store the sample on the database
- It receives each reading until a
NOTE: The readline() function of the Serial library blocks until the newline
character appears on the line.
1 2 3 4 5 6 7 8 9 10 11 12 13 14 15 16 17 18 19 20 21 22 23 24 25 26 27 28 29 30 31 32 33 34 35 36 | import datetime
import serial
import sqlite3
import time
connection = sqlite3.connect('puerta-datos.db',
detect_types=sqlite3.PARSE_DECLTYPES|sqlite3.PARSE_COLNAMES)
cursor = connection.cursor()
## To create the database the first time uncomment this
#print "Creando base de datos..."
#cursor.execute('DROP TABLE datos')
#cursor.execute('CREATE TABLE datos (id INTEGER PRIMARY KEY,
# fecha TIMESTAMP,
# datos VARCHAR(320))') #320 ==> "9999-"x64
#connection.commit()
## To print all the data use this
#print "Visualizando datos:"
#cursor.execute('SELECT * FROM datos')
#for row in cursor:
# print row
s = serial.Serial('/dev/ttyS0', 9600)
print "Port in use:", s.portstr
while True:
cursor.execute('INSERT INTO datos(fecha, datos) values (?, ?)',
(datetime.datetime.now(),
s.readline())
)
connection.commit()
#cursor.close()
#connection.close()
#s.close()
|
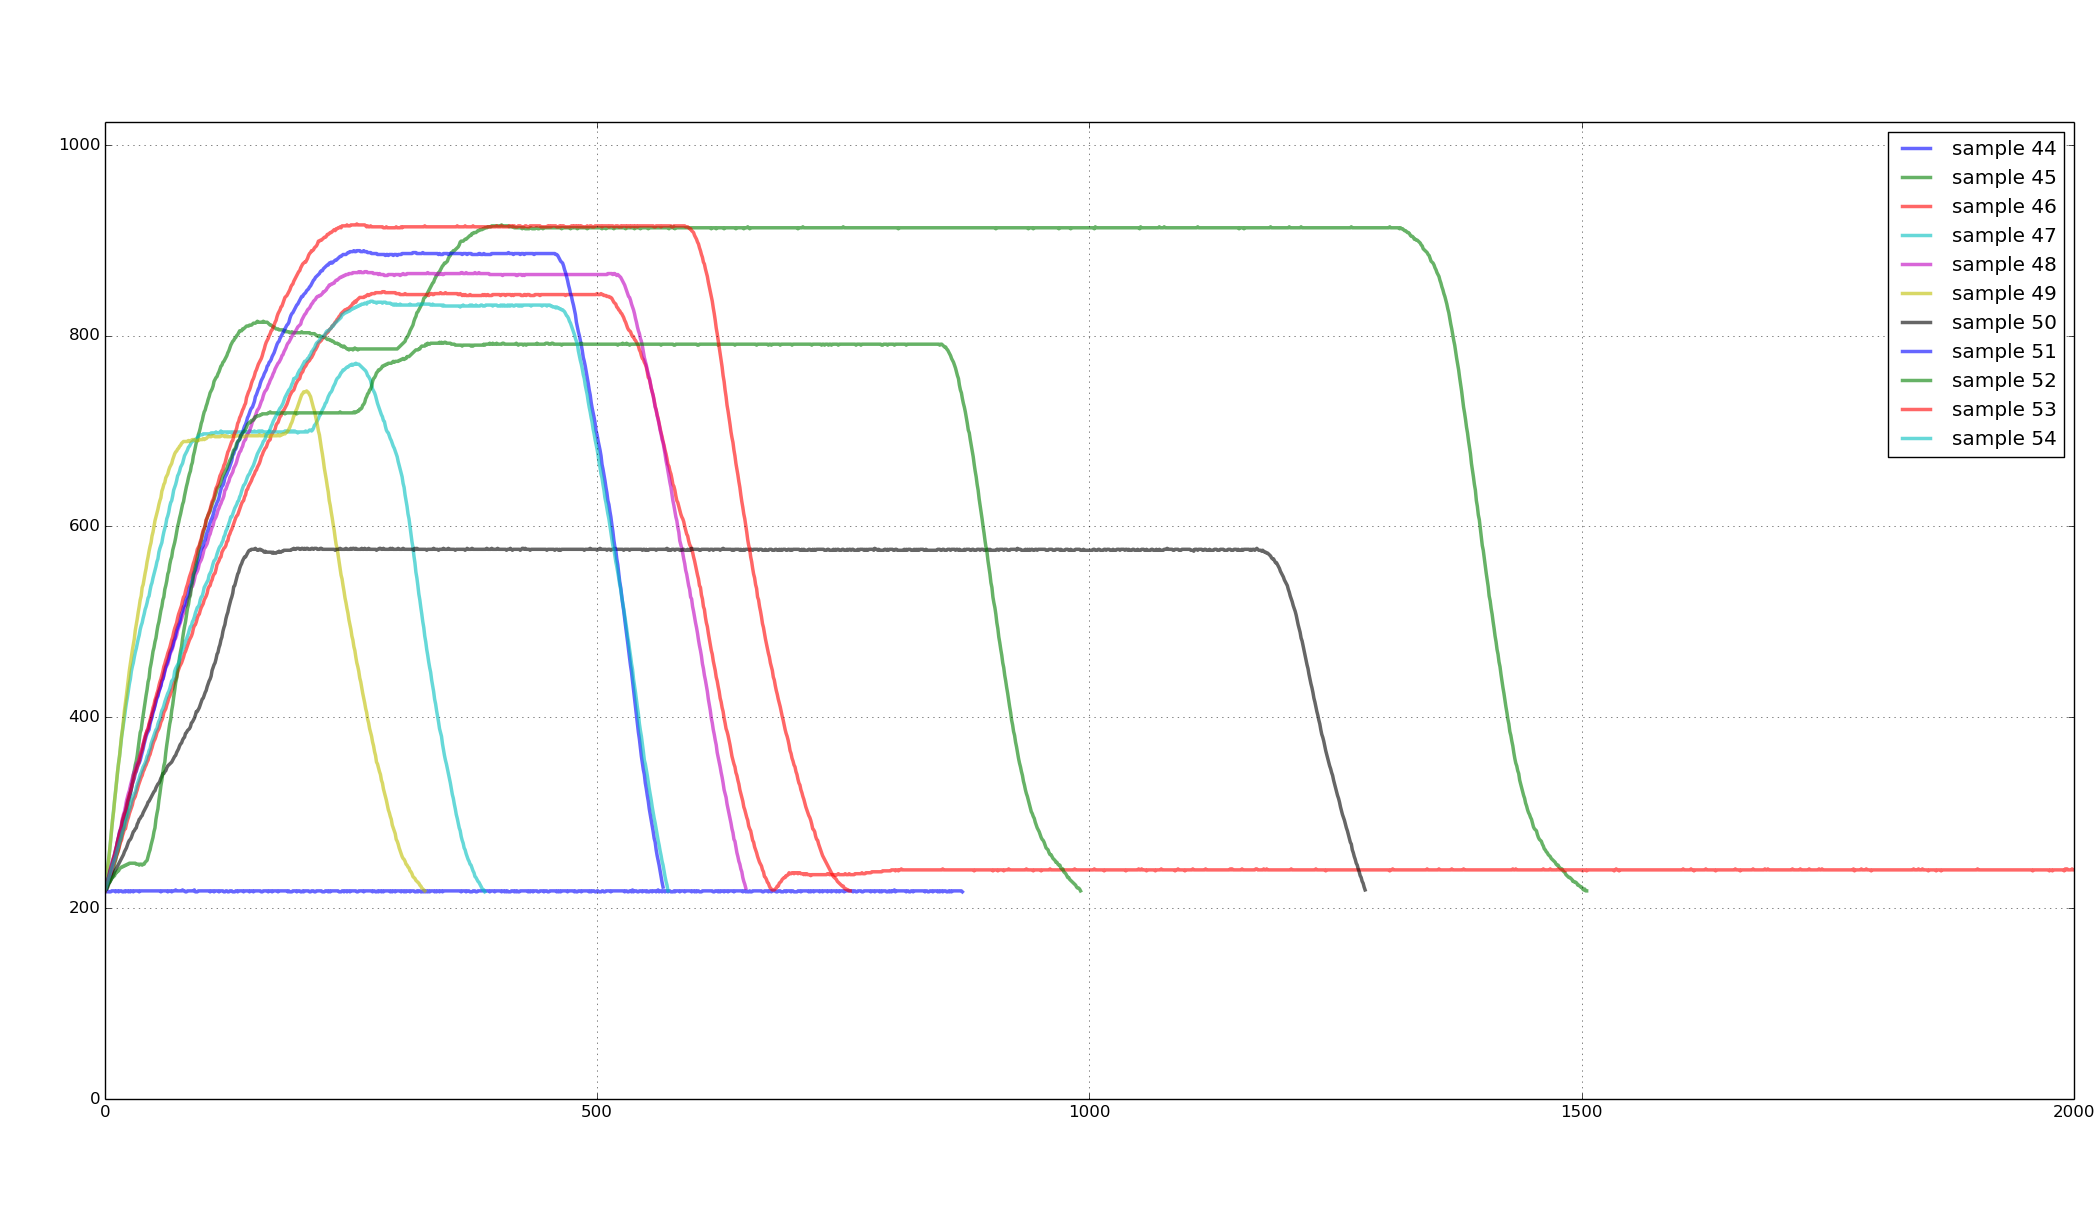
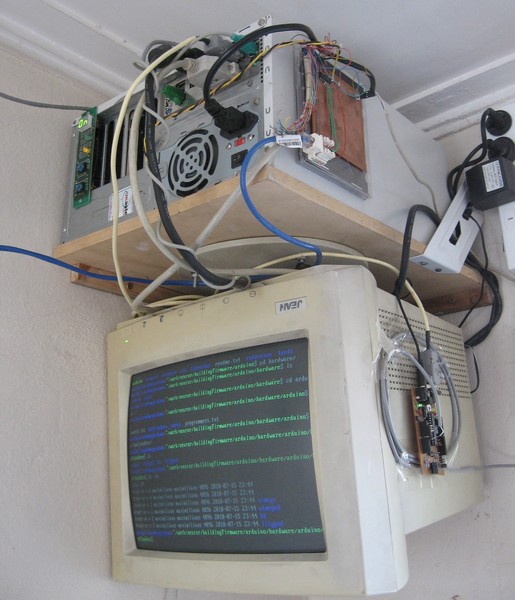
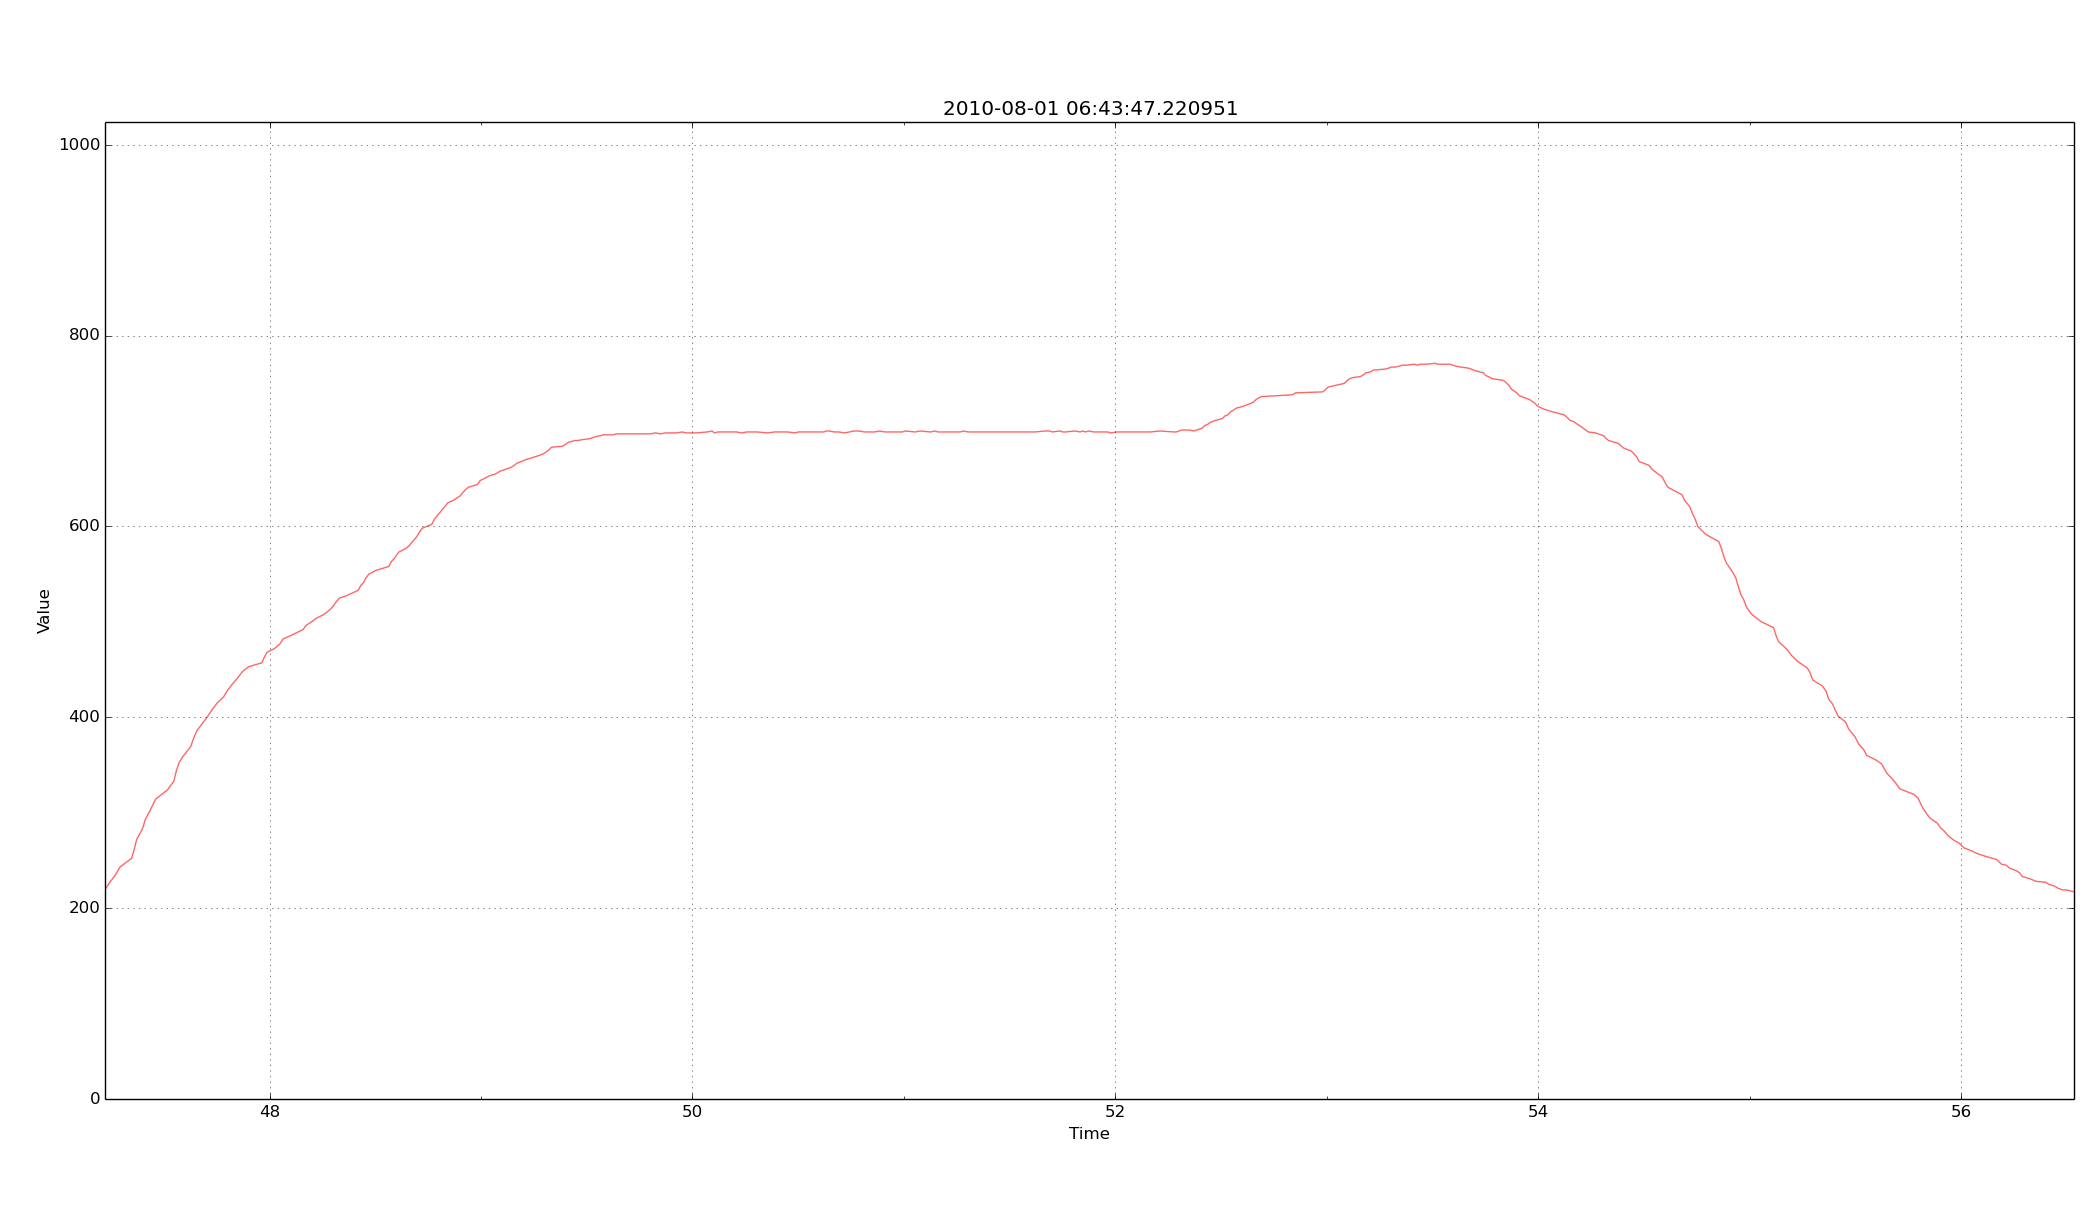
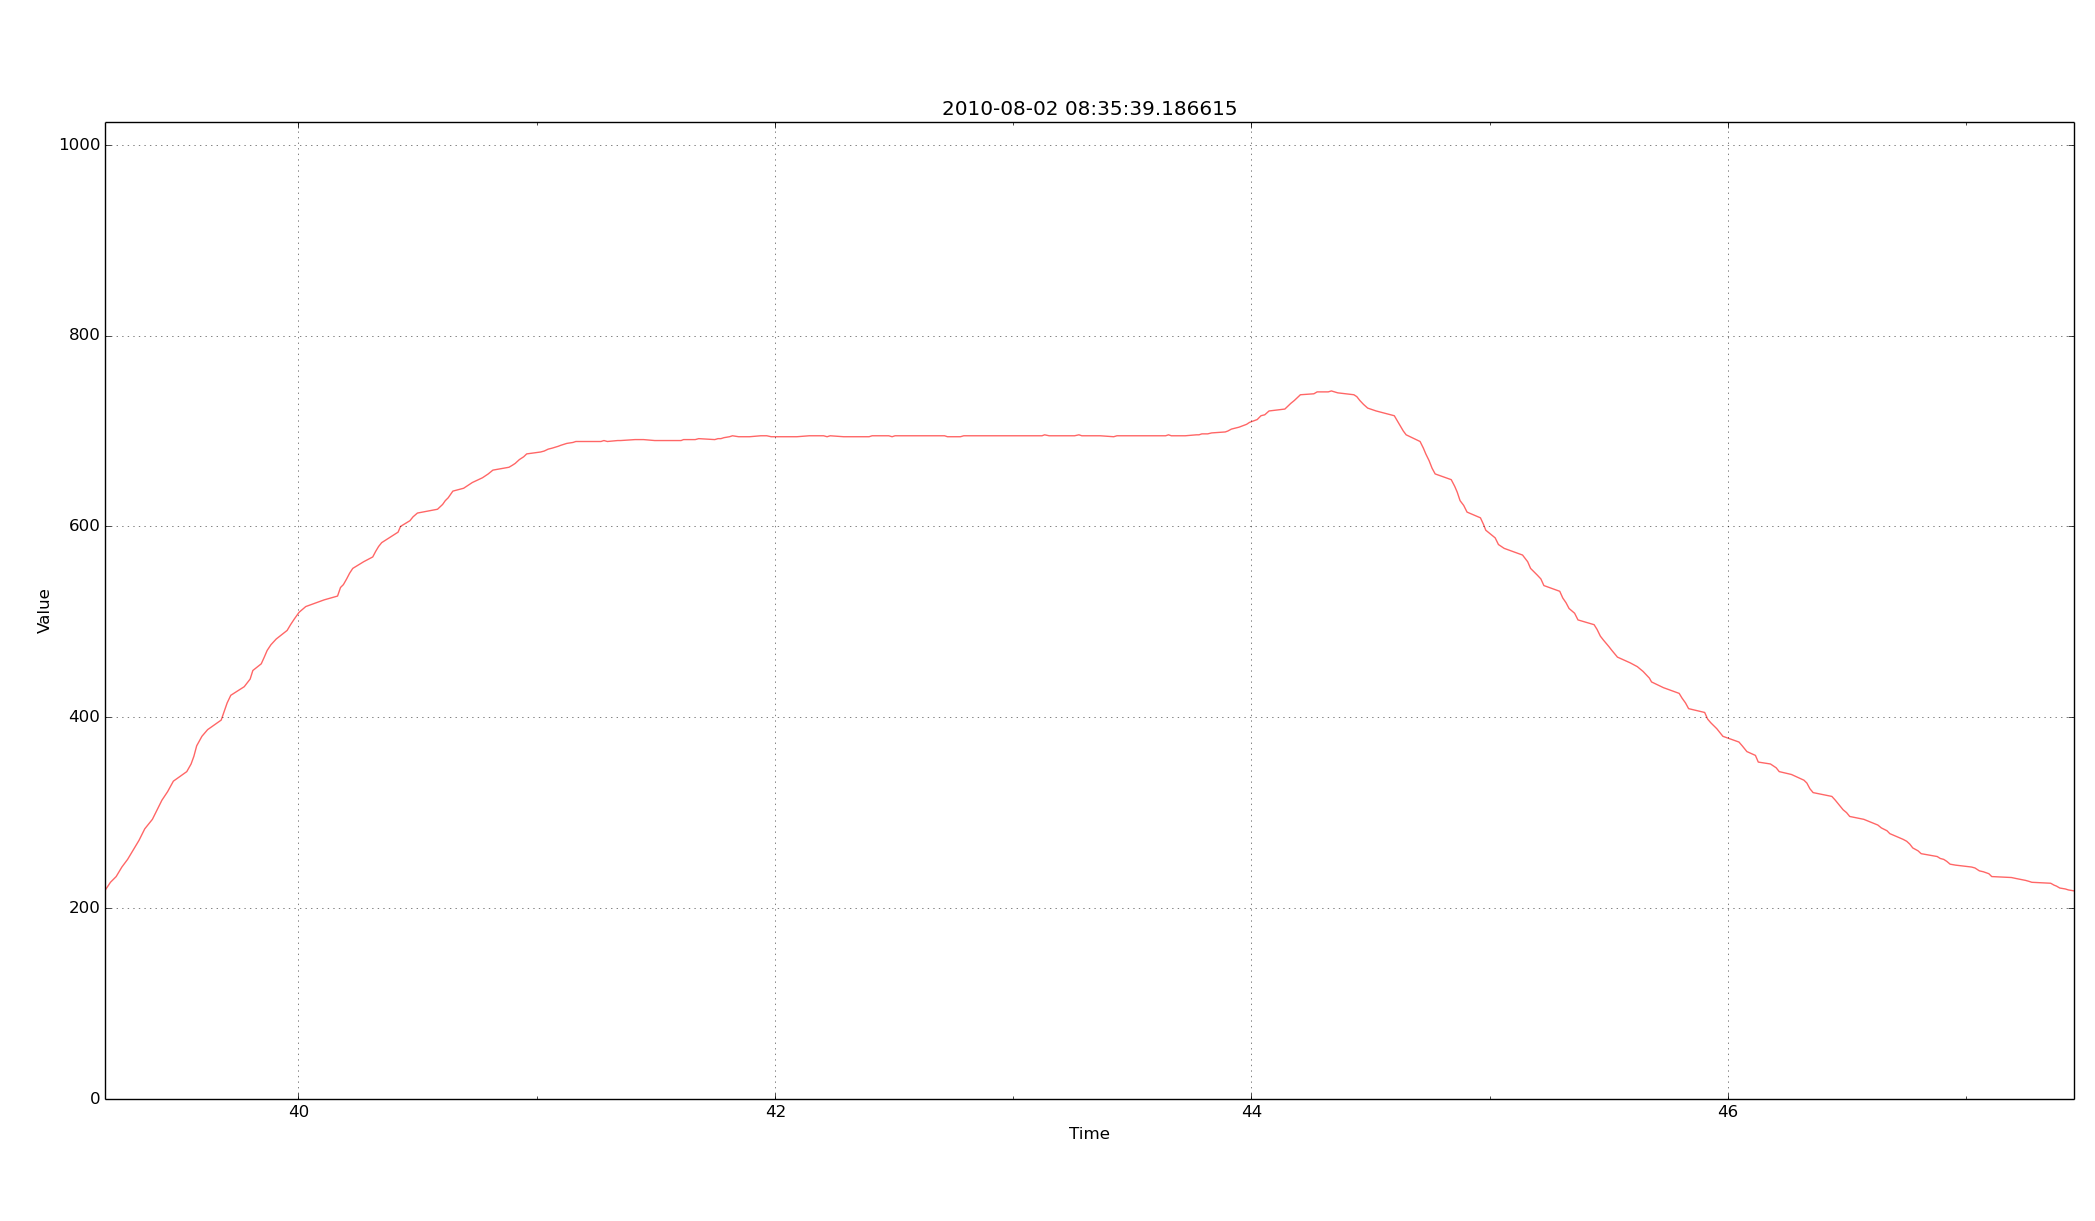
Samples
The samples obtained were very nice. You can tell just by looking at them, the different patters that appear.
See the picture at the beginning of the article. I used matplotlib to plot some of them.
Analysis
Julian started to train some neuronal networks to be able to recognize and group the patterns. He worked with Kohonnen maps.
Sadly we had to quit the project because we got another priorities and we end up abandon the project.
UPDATE (Oct 2014): I put all the samples and code on GitHub in case you're interested.
Author: Maximiliano Padulo
Category: hacks